A video call freezes, a file transfer slows, and everything looks normal by the time IT investigates. Intermittent problems are difficult to diagnose from a live dashboard alone. Historical network data lets the team return to the time of the complaint and look for patterns across devices and connections.
For MSPs and internal IT teams, the real challenge is not collecting more noise. It is finding the brief pattern that explains the slowdown before it becomes a recurring operational nuisance. That is where a platform like Lumics becomes useful: it keeps historical network data for as long as the customer relationship lasts, so engineers can compare current symptoms against old behavior instead of starting from scratch every time. With the right network monitoring software, slowdowns stop being anecdotes and start becoming evidence.
Why Intermittent Slowdowns Stay Hidden In Standard Dashboards

Most monitoring tools are good at exposing sustained problems. They are much less reliable when the issue lasts seconds, not minutes. If a WAN circuit spikes twice an hour for 20 seconds at a time, a smoothed graph can make that look harmless. The bigger the averaging window, the easier it is to flatten the very moment you needed to see.
That matters because intermittent issues are often operationally expensive precisely because they are brief. Users remember the symptom, but not the exact timestamp. Help desk notes are often imprecise. By the time an engineer opens a dashboard, the spike is gone. If the graphing method only shows averages, the evidence is gone too.
Lumics takes a more direct approach by tracking exact min/max bursts instead of relying on smoothing that can hide transient behavior. That distinction sounds small until you are trying to explain why a site that “looks fine” still keeps causing complaints. Min/max visibility is what lets teams distinguish between genuine stability and a chart that simply looks calm because the tool rounded off the truth.
The Problem Is Usually Timing, Not Visibility
A slow application, a jittery voice path, or a brief interface saturation event can all come and go inside a narrow window. If monitoring does not preserve that narrow window, the investigation becomes guesswork. Engineers then end up chasing symptoms after the system has already recovered.
Historical data changes that dynamic. It gives you the ability to say not just “something happened,” but “this happened at this time, on this device, under these conditions.” That is a much better starting point for troubleshooting.
What Strong Investigations Look Like In Practice

Good operators do not begin with root cause. They begin with pattern recognition—a discipline that prevents the diagnostic equivalent of an ai hallucination. The first question is usually whether the slowdown is isolated to one device, one path, one site, or one recurring time window. Historical data is what makes that comparison possible.
Lumics is designed to keep that context close together. Its dashboards synchronize all widgets, event lists, and historical views to the same timeframe, which reduces the classic detective work of bouncing between tabs and manually aligning timestamps. If you are trying to investigate a slowdown that appears only during backup windows, or only after a configuration push, synchronized historical navigation matters more than flashy visuals.
The Clues Worth Looking For
When engineers investigate intermittent slowness, the most useful clues are usually not the dramatic ones. They are the ones that recur in a narrow band. Look for these:
- Repeated peaks at the same hour or after the same job runs
- Brief interface congestion that never appears in average-based charts
- Spikes that line up with config changes rather than traffic volume
- Top offenders that shift over time, suggesting a changing bottleneck
- Dependency changes that move the slowdown upstream or downstream
- Symptoms that affect one site while neighboring sites remain normal
These are not abstract indicators. They are the breadcrumbs that separate a one-off event from an operational pattern. Lumics is especially helpful here because its top offender widgets and historical views let teams inspect the offender list and the underlying timeline together, instead of treating them as separate investigations.
Configuration History Often Explains What Traffic Graphs Cannot

A lot of recurring slowdowns are not caused by raw traffic volume alone. They are caused by change. A device configuration update, a policy adjustment, a routing modification, or a topology shift can create a problem that only surfaces under certain conditions. If you cannot compare configuration history against performance history, you are left guessing whether the slowdown is a capacity issue or a change-management issue.
That is where configuration history comparison becomes strategically valuable. Lumics provides historical configuration tracking so engineers can see whether a device change coincided with degradation. That does not automatically prove causation, of course, but it often narrows the field dramatically. If performance drops after a config change and returns after a rollback or follow-up adjustment, the timeline becomes a lot more meaningful.
This is one of the biggest advantages of keeping long-term data. A problem that appears “intermittent” today may have happened three months ago under a nearly identical setup. Without historical retention, the connection between those events is lost. With it, you can compare before and after states and look for the exact conditions that keep reappearing.
Why Long Retention Changes The Quality Of The Answer
Short retention makes teams reactive. Long retention makes them comparative.
That difference matters because intermittent issues are rarely solved on the first pass. You may need to compare this week’s slowdown against last month’s site update, last quarter’s topology shift, or the last time a backup policy changed. Lumics retains historical performance data for the life of the customer account, which gives teams a durable reference point for those comparisons.
The real value is not just more data. It is better context over time.
How Topology And Dependency Views Turn Symptoms Into Structure
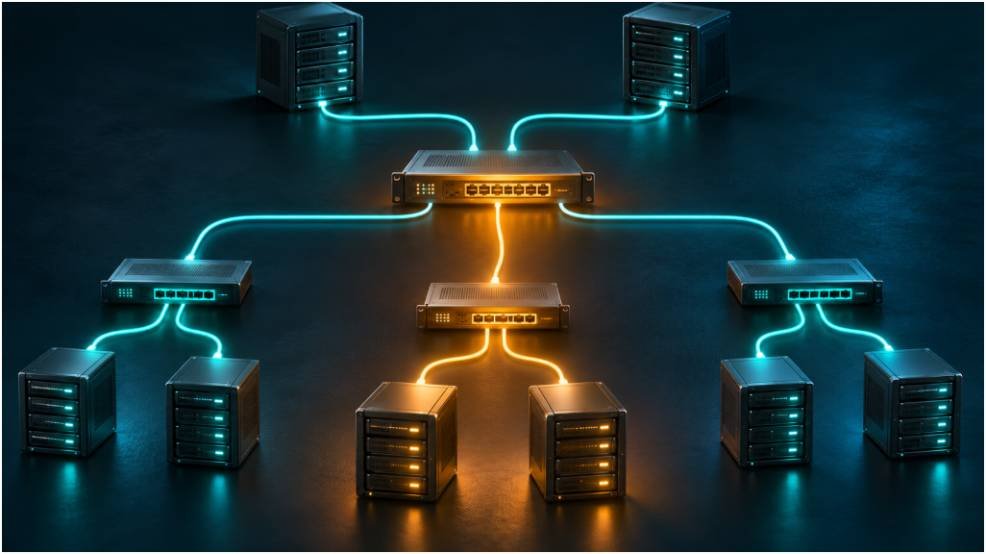
A graph can show that something is slow. It cannot always show where the pressure is traveling. Dependency and topology mapping help answer that second question. If a downstream system is slow because an upstream segment is struggling, you want to see the relationship, not just the symptom.
This is especially useful when the slowdown appears inconsistent from the user’s perspective. One department complains, another does not. One application lags, another is fine. That does not mean the issue is random. It often means the bottleneck sits somewhere in the dependency chain rather than on the device that first got attention.
Lumics adds value here by combining historical performance data with multiple visualization options, including topology, dependency, geographic, and logical views. That gives engineers more than one way to examine the same event. A site-level symptom might make sense in a geographic view, while a dependency path reveals the upstream constraint. In a good investigation, those views should reinforce each other, not compete for attention.
The Practical Standard: Fast, Accurate, And Engineer-Friendly
The best monitoring tools do not make engineers feel clever. They make investigations faster and more reliable—while still respecting modern standards for technology and digital privacy. That is an important distinction. A polished chart that hides detail is less useful than a plain chart that preserves the exact burst that caused the user complaint.
Lumics fits that engineer-first standard because it emphasizes raw telemetry, historical continuity, and synchronized context without requiring on-premise monitoring hardware or heavy local administration. It is a cloud-based platform built for teams that want to spend less time maintaining the tool and more time resolving the problem. In other words, it behaves like a practical instrument, not a decorative dashboard.
For teams investigating intermittent slowdowns, the workflow should be simple:
- Identify the complaint window as precisely as possible.
- Compare the historical graph against the exact time period.
- Check for min/max spikes that averages would hide.
- Review top offenders and event lists together.
- Compare configuration changes against the slowdown.
- Use topology or dependency views to validate the path.
That sequence works because it keeps the investigation anchored to evidence. It avoids the common trap of chasing the loudest symptom instead of the most relevant one.
Intermittent issues are frustrating because they punish weak memory and weak tooling at the same time. The answer is not more guesswork. It is better historical data, better synchronization, and a graphing approach that does not smooth away the event you came to inspect. If you want to shorten root-cause analysis and make recurring slowdowns easier to explain, start by treating history as a first-class diagnostic tool, not an archive.